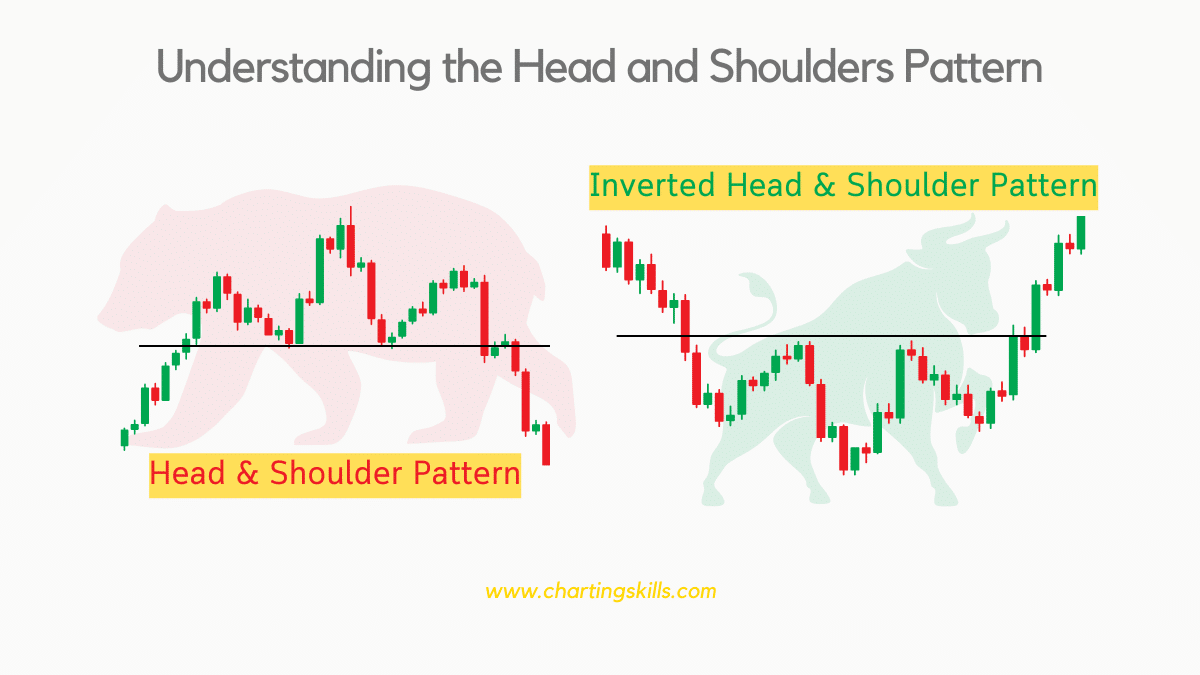
Head and Shoulders Pattern is one of the most commonly used chart patterns. Due to its high success ratio, it is popular among technical analysts worldwide.
We can use this pattern in the Stock Market, Crypto Market, Forex Market, etc. The head and shoulders chart pattern is an easy-to-use pattern.
In this blog post, we will see the head and shoulders chart pattern, how to identify and trade it, etc., so without wasting any time, let’s begin.
What is the Head and Shoulders Pattern?
The Head and Shoulders Pattern is a technical analysis chart pattern we use to predict price moments.
Specifically, there are two head and shoulder chart patterns: Regular Head and Shoulders Pattern (bearish reversal) and Inverted Head and Shoulders Pattern (bullish reversal).
The Head and Shoulders Pattern is formed by three peaks, with the middle peak being the highest (known as the head) and the other two being lower and roughly equal (known as the shoulders).
The pattern is completed when the price starts to trade below the “neckline,” which is a support level connecting the two bottoms of the pattern.
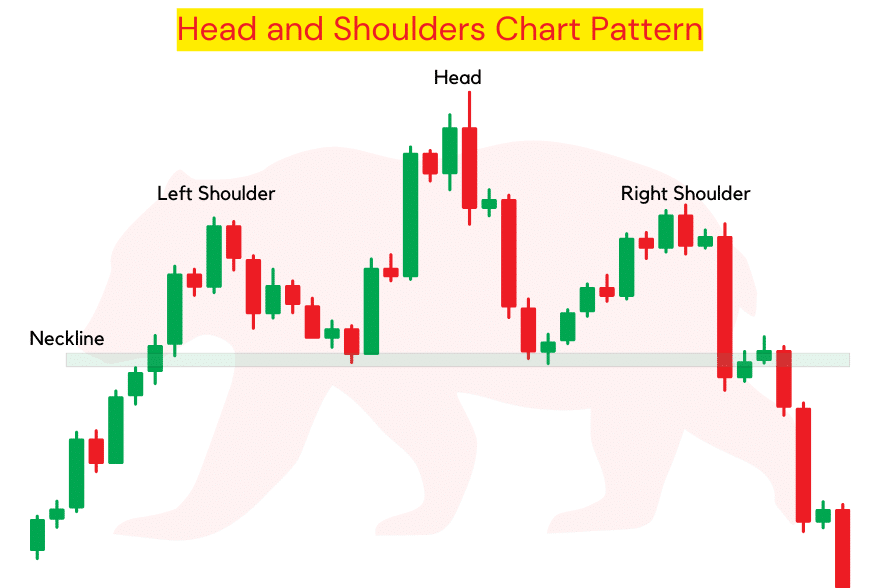
It is a bearish reversal chart pattern, which means if this pattern occurs in an ongoing uptrend, the trend will likely change from up to down.
We can find this chart pattern at the top of the uptrend.
What is an Inverted Head and Shoulders Pattern?
The Inverted Head and Shoulders Pattern is a bullish reversal chart pattern.
If this pattern occurs in an ongoing downtrend, the trend will likely change from down to up.
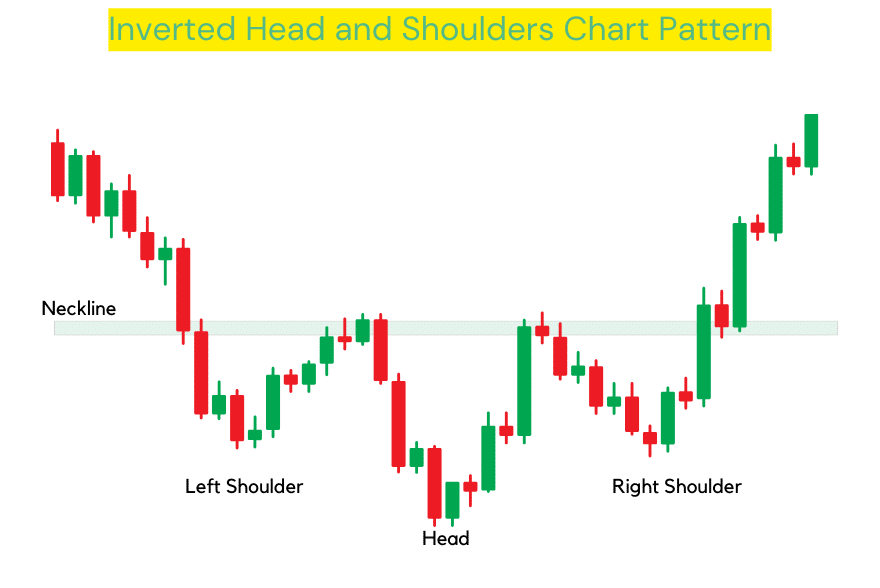
The Inverted Head and Shoulders Pattern is also formed by three peaks, with the middle peak being the highest (known as the head) and the other two being lower and roughly equal (known as the shoulders).
The pattern is completed when the price starts to trade above the “neckline,” which is a resistance level connecting the two tops of the pattern.
How to Identify Head and Shoulders Patterns?
Identifying Head and shoulder patterns is not that hard, but sometimes it can be tricky, especially when you are a beginner.
But, if you have read this post, “Identify Stock Market Trends and Trend Reversals,” in which I explained market trends in a detailed and simple way, it will be easy for you.
If you understand bearish trend reversal well, you can also understand the Head and Shoulders Chart Pattern.
We should look for the left shoulder, head, right shoulder, and neckline to detect the head and shoulders chart pattern.
The psychology behind this pattern is that it represents a shift in market trend from bullish to bearish.
The pattern typically forms after a long uptrend, with three peaks forming in the shape of a “head” in the middle and two “shoulders” on both sides.
The neckline, or support level, is formed by connecting the Higher-low points of the two shoulders.
When the price starts to trade below the neckline, it confirms a trend reversal and signals a potential downtrend.
How to identify an inverted head and shoulders pattern?
Identifying an inverted head and shoulders pattern is the same as identifying a bullish trend reversal.
It is a bullish reversal chart pattern, which we can find at the bottom of the downtrend.
The psychology behind the Inverted Head and Shoulders Pattern is similar to that of the Head and Shoulders Pattern, but there is a trend difference.
It represents a shift in market trend from bearish to bullish.
The pattern typically forms after a long downtrend, with three peaks forming in the shape of an “inverted head” in the middle and two “shoulders” on both sides.
The neckline, or resistance level, is formed by connecting the Lower-High points of the two shoulders.
The psychology behind this pattern is that as the price approaches the neckline, it confirms that the downtrend is ending and buying pressure is increasing.
As the price breaks above the neckline, it triggers a wave of buying as more traders jump in, leading to a further rise in price.
How to Trade the Head and Shoulders Pattern?
Trading both regular and inverted head and shoulder patterns is easy. First, to trade the regular head and shoulders chart pattern, which is bearish, we look for a breakout of the neckline (which works as support).
We take a short position in that stock once the price breaks the neckline with a powerful bearish candle. We add our stop loss above the high of the right shoulder.
We can also trail the stop loss as the price moves in our favor. We take targets as per support levels.
Second, to trade an inverted head and shoulders pattern, which is bullish, we look for a breakout of the neckline (which works as resistance).
We take a long position in that stock once the price breaks the neckline with a powerful bullish candle.
We add our stop loss below the right shoulder low level in an inverted head and shoulders chart pattern.
We can also trail the stop loss as the price moves in our favor. We take targets as per resistance levels.
Examples of Both Head and Shoulders Chart Patterns
Example 1 of Regular Head and Shoulders Chart Pattern
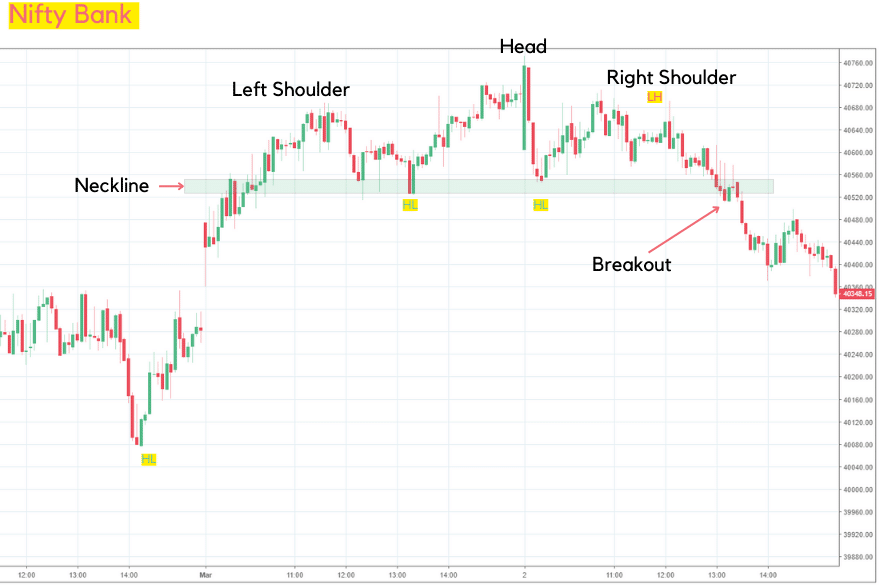
As you can see in the first example, there was an uptrend in the price chart. It was following Higher-Higher and Higher-Low.
Then, we can see a clear head and shoulders chart pattern. We can see that the Lower-High breaks the Higher-Low, which means the uptrend changes to a downtrend, and this pattern also indicates that.
Example 2 of Inverted Head and Shoulders Chart Pattern
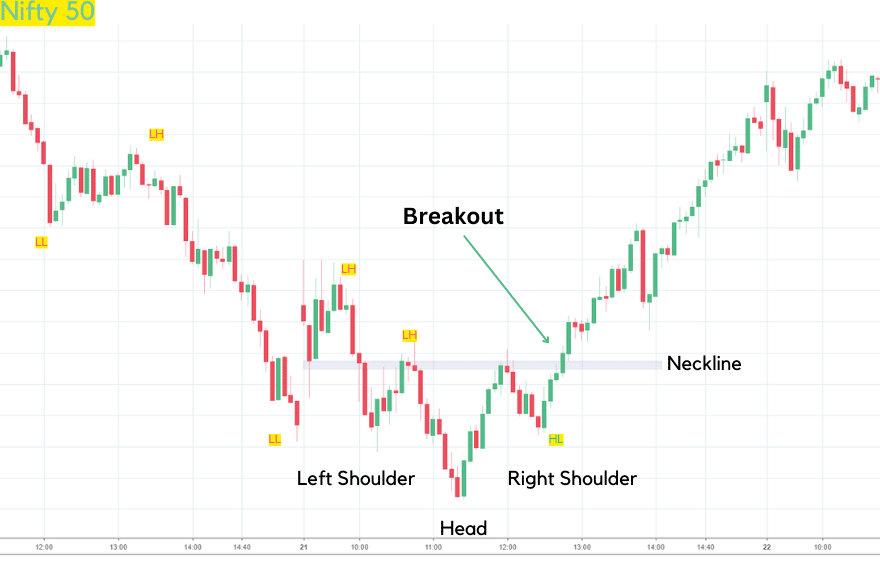
As you can see in the 2nd example of the Inverted head and shoulders chart pattern, there was a clear downtrend.
Price was moving in Lower-Low and Lower-High formation. Then, after one point, the price stops going below the lower level, forms a new higher level, and breaks the neckline, which shows buying pressure.
Things To Consider Before Trading Head And Shoulders Chart Pattern
Before trading the head and shoulders chart pattern, there are a few things to consider:
Market Trend: You should always trade the head and shoulders pattern in a proper market trend. It will fail if you try to trade it in the sideways market.
You should trade a regular head and shoulders chart pattern in an uptrend and an inverted head and shoulders chart pattern in a downtrend.
Stop Loss: It’s crucial to use a stop loss to limit the losses in case the trade doesn’t go as planned.
In the case of a head and shoulders pattern, the stop loss should be placed above the right shoulder.
The stop loss should be placed below the right shoulder in an inverted head and shoulder pattern.
Entry: Your entry should be on the breakout of the neckline. If you try to take entry before, it would sometimes work. And you won’t be able to trade patterns correctly.
Target: Targets should be based on support and resistance levels. You can also choose the target as the distance between the head and neckline projected downwards from the neckline.
In an inverted head and shoulders pattern, the target should be the distance between the head and neckline projected upwards from the neckline.
Conclusion
The Head and Shoulders Pattern is an important chart pattern traders use to predict market price movements.
A bearish reversal chart pattern (regular head and shoulder chart pattern) signals a potential trend reversal from bullish to bearish.
On the other hand, the Inverted Head and Shoulders Pattern is a bullish reversal chart pattern that signals a potential trend reversal from bearish to bullish.
You should also remember that no chart pattern is 100% accurate, and you should always use risk management techniques like stop-loss orders to limit your losses.
