Double Top and Double Bottom are popular chart patterns used in technical analysis to predict future price movements.
We can find these patterns around support and resistance levels. Traders use Double Top and Double Bottom chart patterns to identify potential buying and selling opportunities.
In this blog post, we will understand double top and double bottom chart patterns in depth and see some examples to understand how to trade Double Top and Double Bottom chart pattern chart patterns.
What is Double Top and Double Bottom?
Double Top and Double Bottom are bearish and bullish chart patterns technical analysts use to predict price movements.
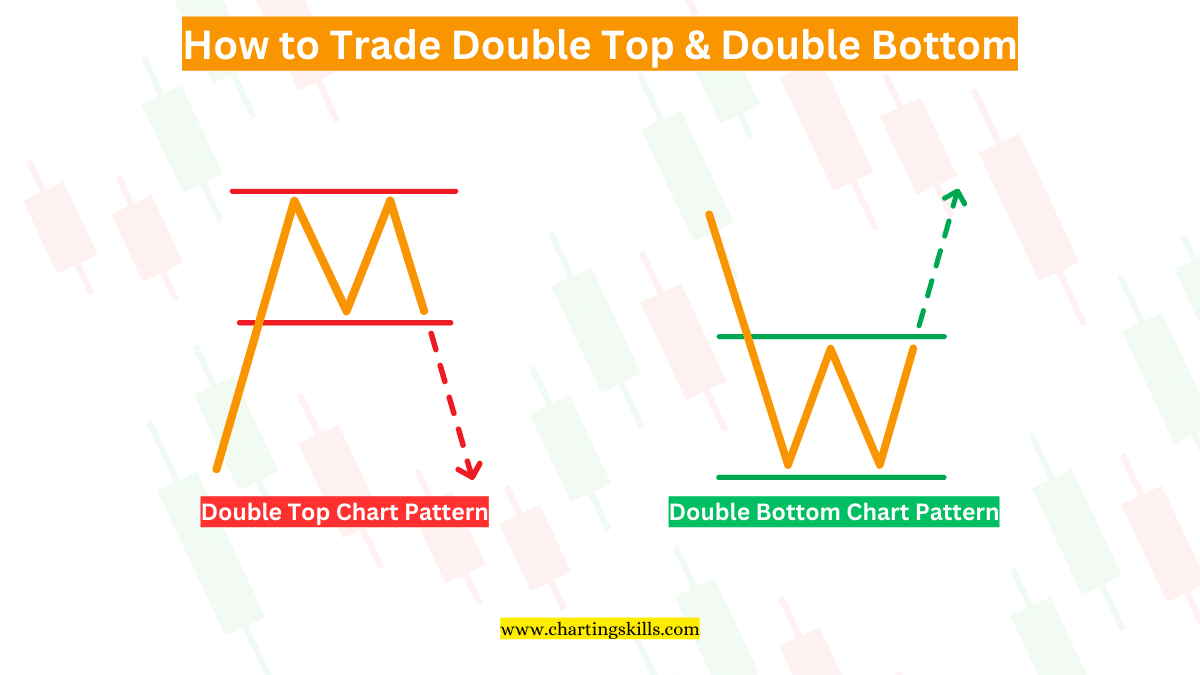
These patterns are commonly referred to as “M” and “W” patterns due to their shape.
The Double Top pattern looks like an “M” while the Double Bottom pattern looks like a “W.”
The Double Top is a bearish reversal chart pattern. Like other bearish reversal candlestick patterns such as bearish engulfing, shooting star, evening star, etc., this is a bearish reversal pattern but a chart pattern.
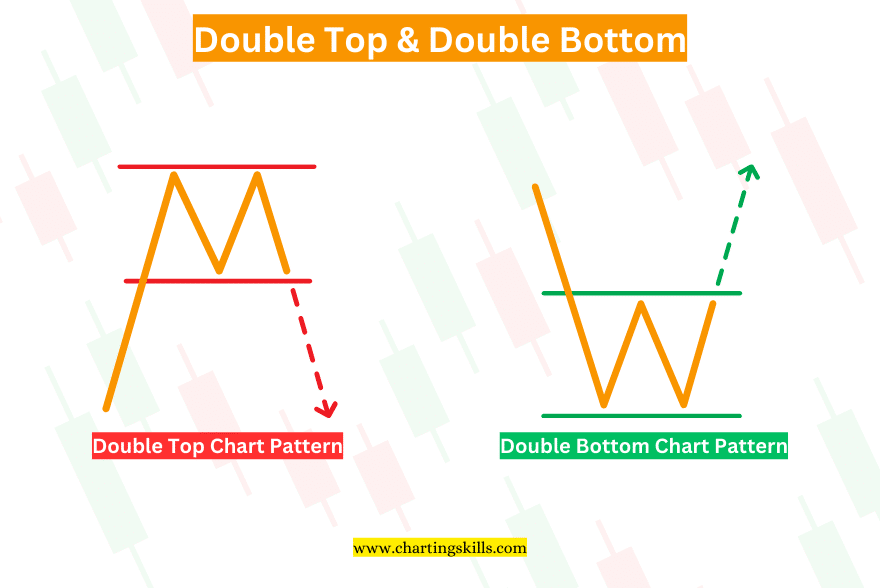
The Double Bottom is a bullish reversal chart pattern. Like other bullish reversal candlestick patterns such as bullish engulfing, morning star, hammer, etc., this is a bullish reversal pattern but a chart pattern.
Double Top Chart Pattern
Double Top is a bullish reversal chart pattern. It appears on a chart as two peaks of similar height, separated by a trough.
It indicates that the price has reached a resistance level twice and failed to break through resistance.
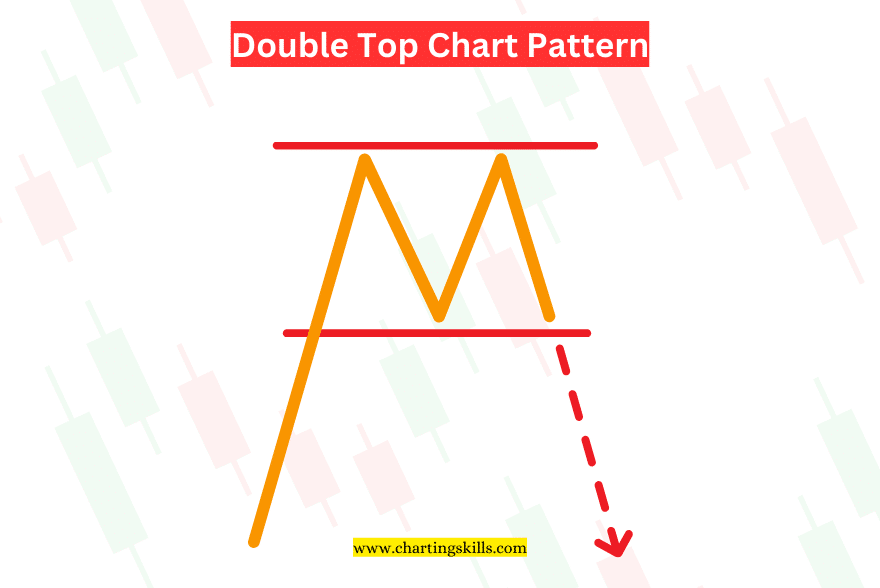
Double Top is also known as the “M” pattern because it resembles the letter M in English.
The psychology behind the double top is that the price moves in an uptrend, which means bulls are pulling prices up, but suddenly, at some point, they face rejection, and the price starts to decline.
The price tried to go up again but faced rejection on the same previous resistance level and started to fall, but this time, as the price hit resistance a second time, sellers were more active than the previous time, and they started to pull the price down.
In the Double Top pattern, there are two tops and one neckline.
The neckline in the double-top pattern is drawn by connecting the lows of the two troughs that form between the two peaks.
This line acts as a support level, and once the price breaks below the neckline, it confirms the downtrend or price reversal.
Traders often use the neckline as a signal to enter a short position.
Example of Double Top Chart Pattern
Example 1
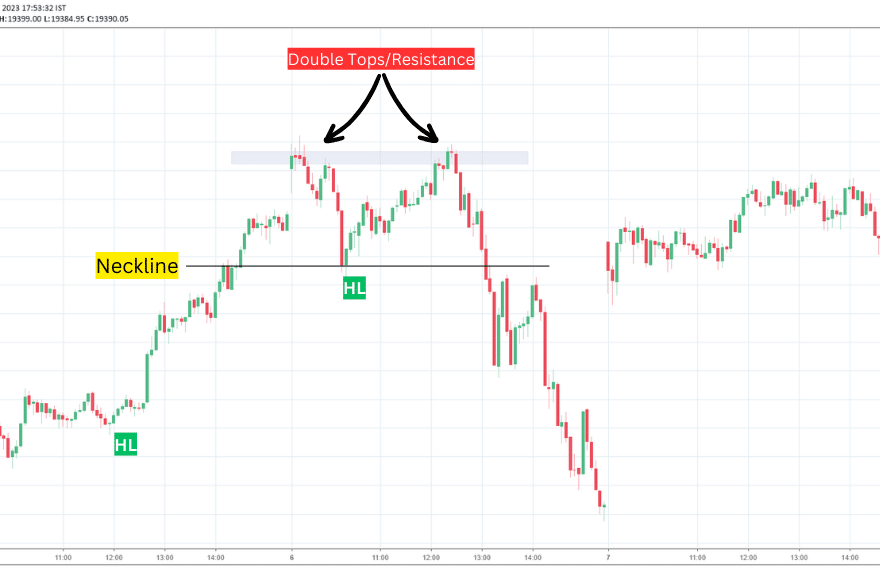
As you can see in the above image, It’s Nifty 50’s 5m time frame chart. We can see that the price was in an uptrend. Then, around 17,870 (values are not visible in the example shown above due to image size), it faced rejection for the first time.
After some time, it faced rejection on the same 17,870 level, and we can see the evening star candlestick formation.
We can enter there with few quantities and add stop loss above the high of the evening star candlestick pattern.
We can add the rest of our quantities after the breakout of the neckline and can move our stop loss a little below.
Example 2
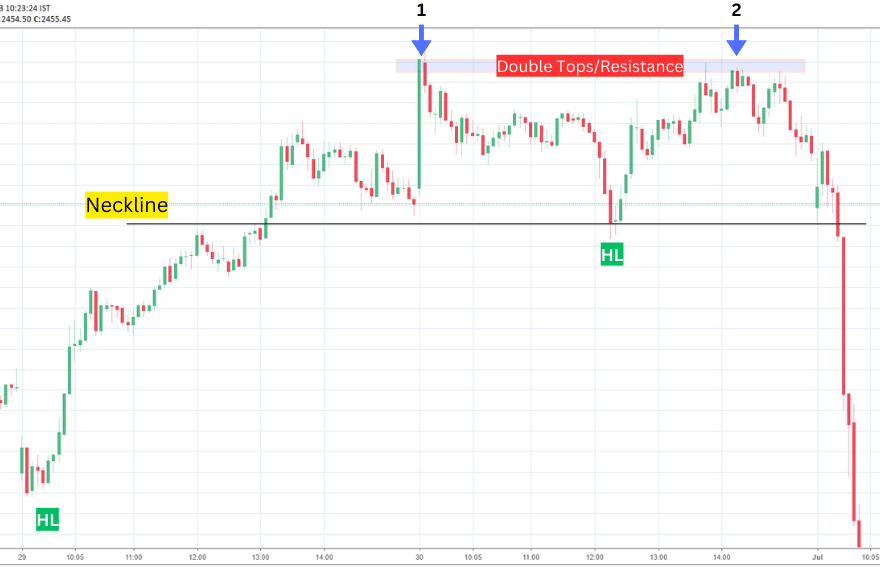
As you can see in the second example of a double top chart pattern, It’s Reliance 5m time frame chart. We can see that the price was moving in an uptrend by making Higher-High and Higher-Low.
At first, it faced rejection around the 2490 level, and the price fell. Then again, at the second attempt to break this resistance level, the price failed to break and started falling.
This time, we can see that as the price breaks the neckline, it falls sharply by continuously making big red candles. We can see here that the selling pressure was too high.
Double Bottom Chart Pattern
The Double Bottom chart pattern is opposite of the Double Top. It’s a bullish reversal chart pattern, which we can find at support levels in the downtrend.
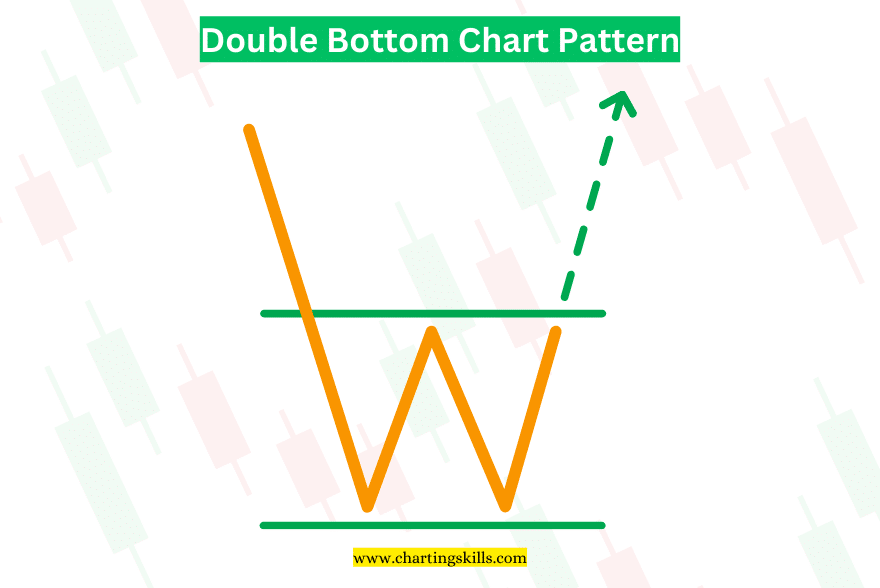
Double Bottom is also known as the “W” pattern because it resembles the letter W in English.
The psychology behind the Double Bottom pattern is something like this: Price was in a downtrend and made two consecutive lows that finally indicated a reversal.
This pattern suggests that buyers are gaining control of the market, and the sellers are losing steam.
A Double-bottom pattern indicates a potential trend reversal, and traders often use it as a buy signal.
Similar to a double-top pattern, a double-bottom pattern also has a neckline that acts as resistance. When the price breaks above this neckline, it is a buy signal.
Example of Double Top Chart Pattern
Example 1
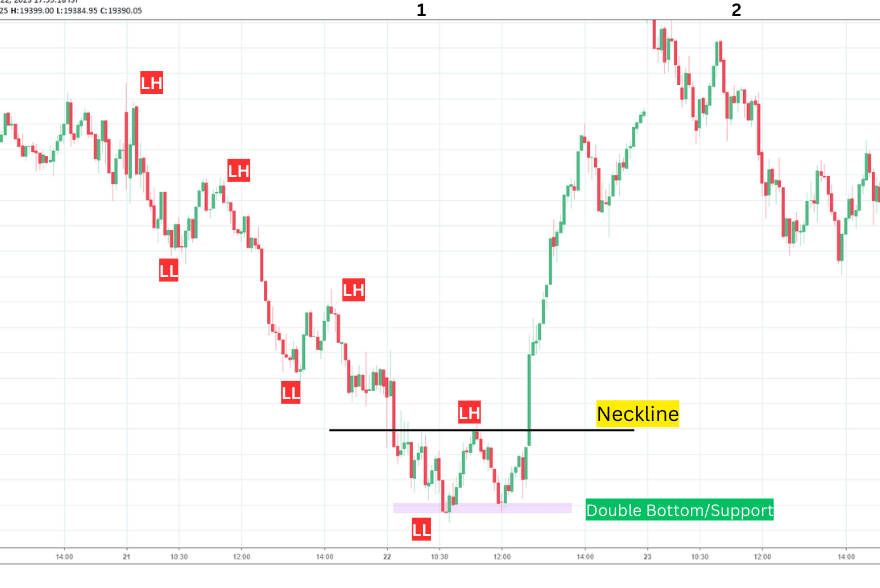
In the first example of a double-bottom chart pattern, we can see that the price was initially moving in a downtrend.
After finding support the first time, it went down again, trying to break the support zone.
However, it failed to do so, and instead, the price broke the neckline. This resulted in a big green candle, indicating a surge in buying pressure, and the price started to move in an uptrend.
Example 2
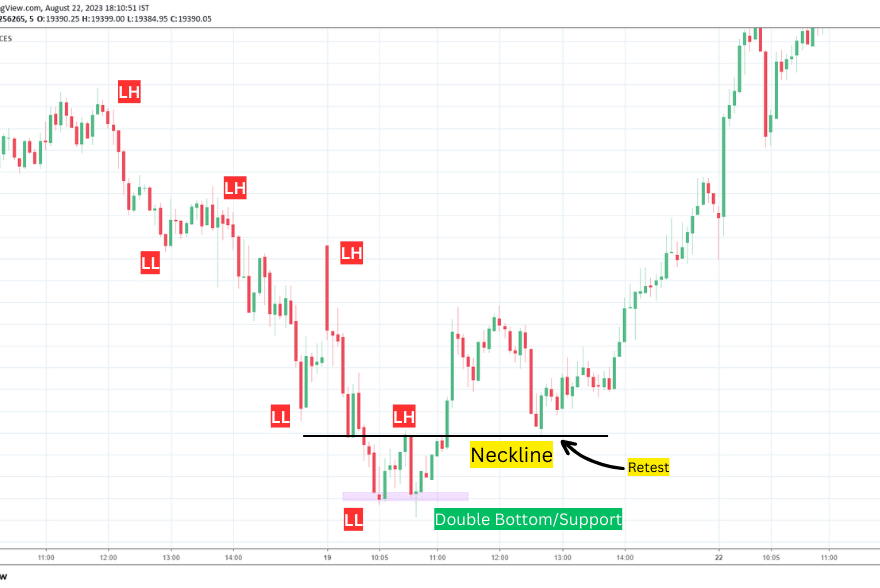
In the second example of a double-bottom chart pattern, we can see that the price was initially in a downtrend. After the first support, it tried to break the support level again but failed and broke the neckline.
In this scenario, you can enter on neckline breakout, ensuring to keep a stop loss below the low of the previous swing.
Later on, the price came again on the neckline level to retest. You can add the rest of your quantities and move your stop loss below the retest low level.
Limitations of Double Tops and Bottoms
Double tops and bottoms are a popular chart pattern used in technical analysis to predict future price movements.
While they can be helpful most of the time, it’s important to be aware of their limitations.
One major limitation of double tops and bottoms is that they can sometimes be confusing to newbies, and they might trade them at the wrong location.
Your stop loss may hit if you trade double tops and bottoms at the wrong location.
Another limitation is that double tops and bottoms are not always reliable for future price movements.
While they can signal a trend reversal, they can also give false signals. Traders need to use other tools and analysis techniques to confirm a pattern before making trading decisions based on it.
Conclusion
The double-top and Double Bottom chart patterns are widely used by technical analysts worldwide.
These patterns are considered reliable for a potential reversal in the market trend.
By identifying double-top and Double Bottom chart patterns, traders can make the right decisions about when to enter or exit a trade, improving their chances of success.
With its popularity, it’s clear that the Double Top and Double Bottom patterns are a valuable tool for traders looking to maximize their profits and minimize their risks.


Can you explain other chart patterns as well? Thanks.
Hey Neha, Happy to help, Sure I am explaining all chart patterns one by one. Make sure you subscribe to updates.