RSI divergences are commonly used patterns in intraday trading.
This guide will provide a complete overview of trading RSI divergences, covering everything you need to understand.
What is an RSI Divergence?
RSI divergence occurs when the Relative Strength Index (RSI) indicator moves in the opposite direction to the price of an asset, suggesting a potential reversal in the current trend.
RSI is a technical analysis tool used to predict changes in market direction.
What does it mean in the opposite direction to the price?
It means the price of an asset moves up or down, but the RSI indicator moves in the opposite direction to the price. That’s why we call it a divergence.
It is very simple to find RSI divergence on a chart.
RSI Divergence can be categorized into bullish and bearish divergence chart patterns.
Let’s check out some examples of RSI divergence.
Bullish RSI Divergence
In Bullish RSI Divergence on the price chart, the price keeps going down, making lower lows.
At the same time, we can see that the RSI indicator value is making higher lows.
To make it clearer for you, here is an example of a bullish RSI divergence on the chart:
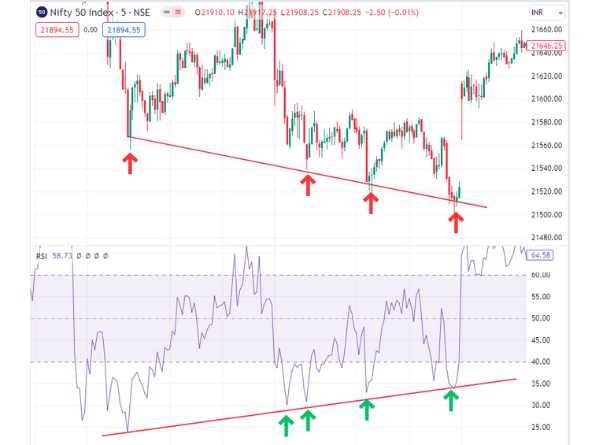
As you can see in the above chart image of the nifty 50 index, it’s a 5-minute time frame chart.
We can see that the price was falling, and at first, the RSI was also following the price and making Lower Lows.
But after some time, the RSI starts making higher lows while the price decreases.
That is what we call a bullish RSI divergence. And once a bullish RSI divergence appears, the price starts to go up from down.
Like bullish rsi divergence, there is bearish rsi divergence as well. Let’s understand that now.
Bearish RSI Divergence
The bearish rsi divergence is the opposite of the bullish rsi divergence.
It’s very easy to identify bearish RSI divergence on the chart.
In this divergence, we need a price to make higher highs, and at the same time, rsi should be making lower highs.
To make it clearer for you, here is an example of a bearish RSI divergence on the chart:
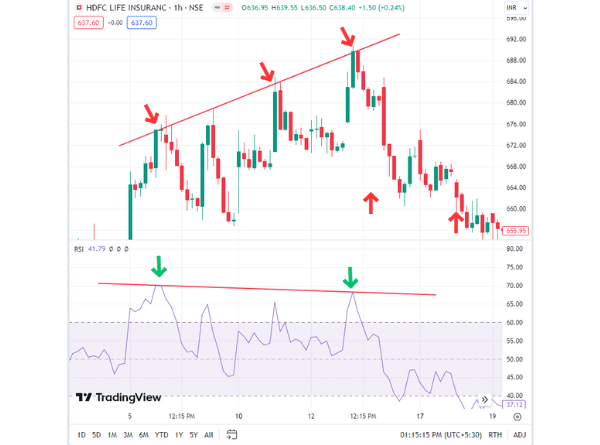
Check the above chart image of HDFC Life Insurance.
The price and RSI indicators were going in the same direction. At that time, the RSI value was 70.
Later, when the price reaches a new high, the rsi value decreases to 68.23.
That is what we call a bearish RSI divergence. And after that, you can see price trend changes from up to down.
What does an RSI divergence indicate?
The RSI divergence is a powerful tool traders use to identify changing trends.
When we see a bullish divergence, we should be alert because it could mean the trend might change from down to up, and we should start to exit our short positions if that happens.
On the other hand, when we notice a bearish divergence, we should anticipate a shift in the trend from bullish to bearish, and we should start to exit our long positions if that happens.
How to use divergences to trade?
We can use RSI divergence for entry and exits from our trades.
We can use RSI divergence to take entry in the trade, as RSI divergence indicates that a new trend is about to begin.
Also, we can use divergences to decide when to exit from trades, as it signals the end of the trend.
This is how we can use RSI divergence for our entry and exit. Now, Let’s learn how to find these RSI divergences step by step and then figure out when to take our trades.
How to find RSI bullish divergences step by step
Step 1 – Identify a downward trend characterized by a sequence of consistently lower lows
First of all, we should find a stock whose price is making lower lows.
For a bullish divergence, we need the stock price to move in a downtrend.
Here is an example of a chart in which we can spot a downtrend:
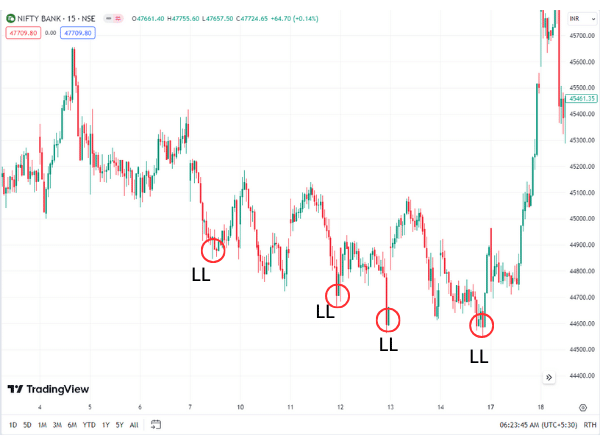
On the above chart of the Bank Nifty, we can see that the price was making lower lows.
*Step 2 – Check the RSI at the price lows
Now that we have spotted the consecutive series of lower lows, we can check what the RSI indicator is doing at those lows.
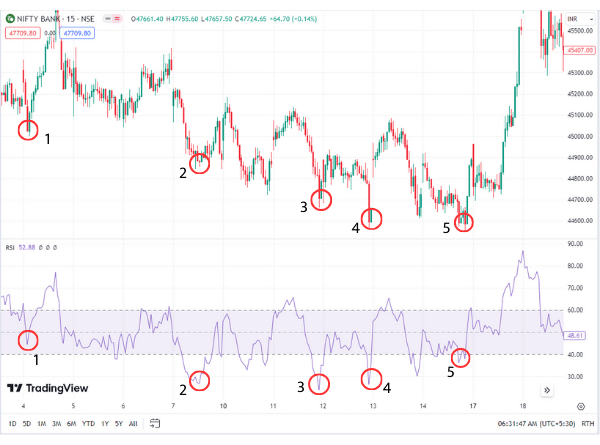
Here is the RSI indicator for the above chart:
Step 3 – Compare the lows and find a divergence
In the third step, we have to check and compare price lows and RSI values.

As you can see in the above chart image when the price hit low for the first time, the RSI value was 44.51; when the price hit low for the second time, the RSI value was 26.85.
On the third time, it was 23.79; and on the fourth time, it was 26.35.
Now if we compare the third time’s RSI value with the fourth time, we can spot a change in value.
From the fourth low, the RSI value starts to rise, but we can see that the price is still making lower lows.
After making the fifth low by price, the RSI value rose to 38.03, which indicates our bullish divergence.
Step 4 – How to take trade
As of now, we spot the divergence but don’t take trades by just finding a bullish RSI divergence.
We should always check other factors such as chart patterns, price action, indicators, etc.
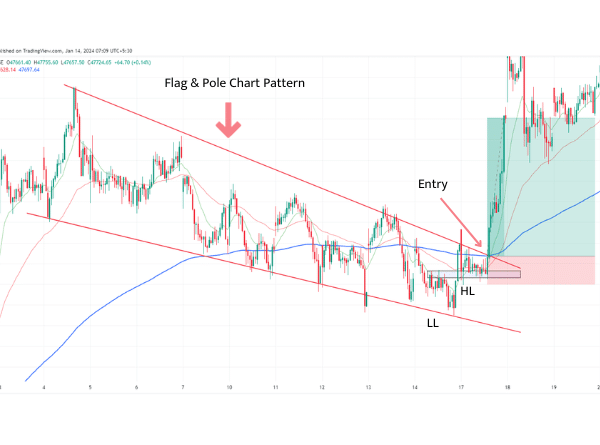
In this case, there was a flag-and-pole chart pattern on the price chart.
Next, after the fifth low, the price starts to make higher lows.
At that point, we can check our triple EMA setup, in which we use 13, 50, and 200 EMA. In our triple EMA setup, we can spot a cross-over.
Points which confirm our trade:
- Flag and Pole Chart Pattern Breakout
- Change in price trend
- Triple EMA crossover
- Small stop loss
We can enter the strong bullish candle in the last 20 seconds of candle closing. Add our stop loss just below the low of our entry candle.
After our entry, you can see how the trend changes in price and starts to go up by making big candles.
Free TradingView users who can add only limited indicators to the chart can download this triple EMA setup from here: Download Triple-EMA setup, it is free and easy to use.
How to find RSI bearish divergences step by step
Step 1 – Identify an uptrend characterized by a sequence of consistently Higher Highs
Finding RSI bearish divergences is the opposite of finding RSI bullish divergences.
To find a bearish RSI divergence, we first have to spot an uptrend or a series of consistently higher highs.
Finding a long-term uptrend with numerous higher highs is not necessary.
A few are enough.
Check out the chart image below:
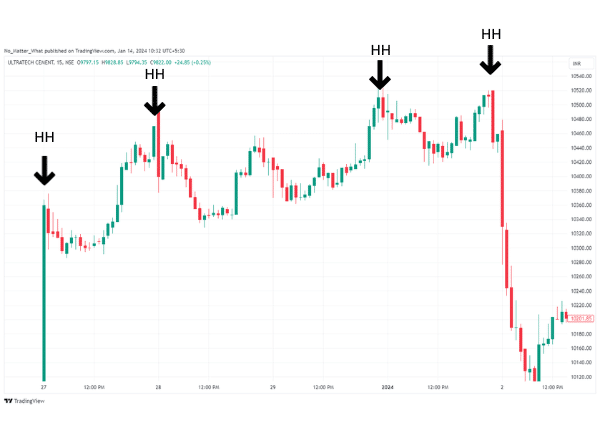
On the above chart of Ultratech Cement, we can see that the price was making higher highs.
Step 2 – Check the RSI at the price highs
Now that we have spotted the consecutive series of lower lows, we can check what the RSI indicator is doing at those highs.
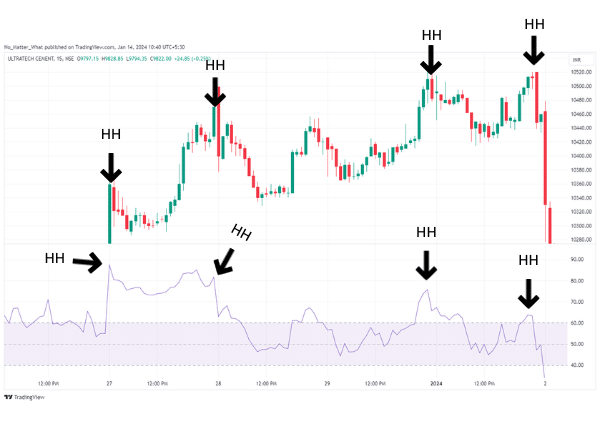
So we will add the RSI indicator and mark the higher highs with the values of RSI with those same highs.
Here is the RSI indicator, with highs marked on it:
Step 3 – Compare the highs and find a divergence
In the third step, we have to check price highs and RSI values by comparing them.
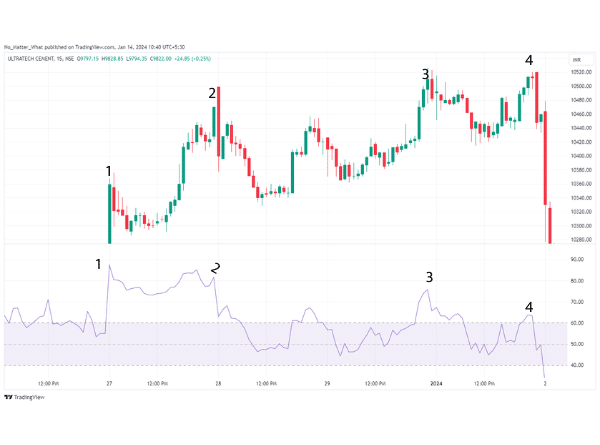
As you can see on the above chart image, when the price hit high for the first time, the RSI value was 87.41; when the price hit low for the second time, the RSI value was 81.59.
On the third time, it was 73.75, and on the fourth time, it was 63.75.
If we compare the first and fourth RSI values, we can see a decline in the RSI value.
From the second high, the RSI value starts to decline, but we can see that the price is still making higher highs.
After making the fourth high by price, the RSI value fell to 63.75, which indicates our RSI bearish divergence.
What you learned today
Here are a few important points which you have learned today in this post:
- RSI Divergence: This is when the price trend and the RSI indicator trend don’t match on a chart.
- Bullish Divergence:
- Price: Making lower lows.
- RSI Indicator: Making higher lows.
- Bearish Divergence:
- Price: Making higher highs.
- RSI Indicator: Making lower highs.
- Significance of Divergence: Indicates a potential change in the price trend, even if it might be temporary.
- Usage in Trading: Divergences can be used to decide when to enter or exit trades.


